Responsive Web
UniSuper Product Comparator
01.-
Context
Background
UniSuper is an Australian superannuation fund that provides superannuation services to employees of Australia's higher education and research sector. The fund has over 400,000 members and $65 billion in assets.
The current-state research revealed a significant opportunity to facilitate enhanced understanding and informed decision making among new Defined Benefit Division members. Although members expressed an intention to take appropriate action and established their account optimally, many did not feel adequately equipped to achieve this outcome.
02.-
Objectives
Business Opportunity
Goals for website
• Simplify the onboarding experience for Defined Benefit Division members
• Help members decide on their product fit based on their profile and risk tolerance
• Create an experience that its together with adjacent DBD projects and processes
Problem Statement
How might we create an experience that explains the Defined Benefit Division product and empowers the member to configure their super account based on their needs and at their convenience?
03.-
Research
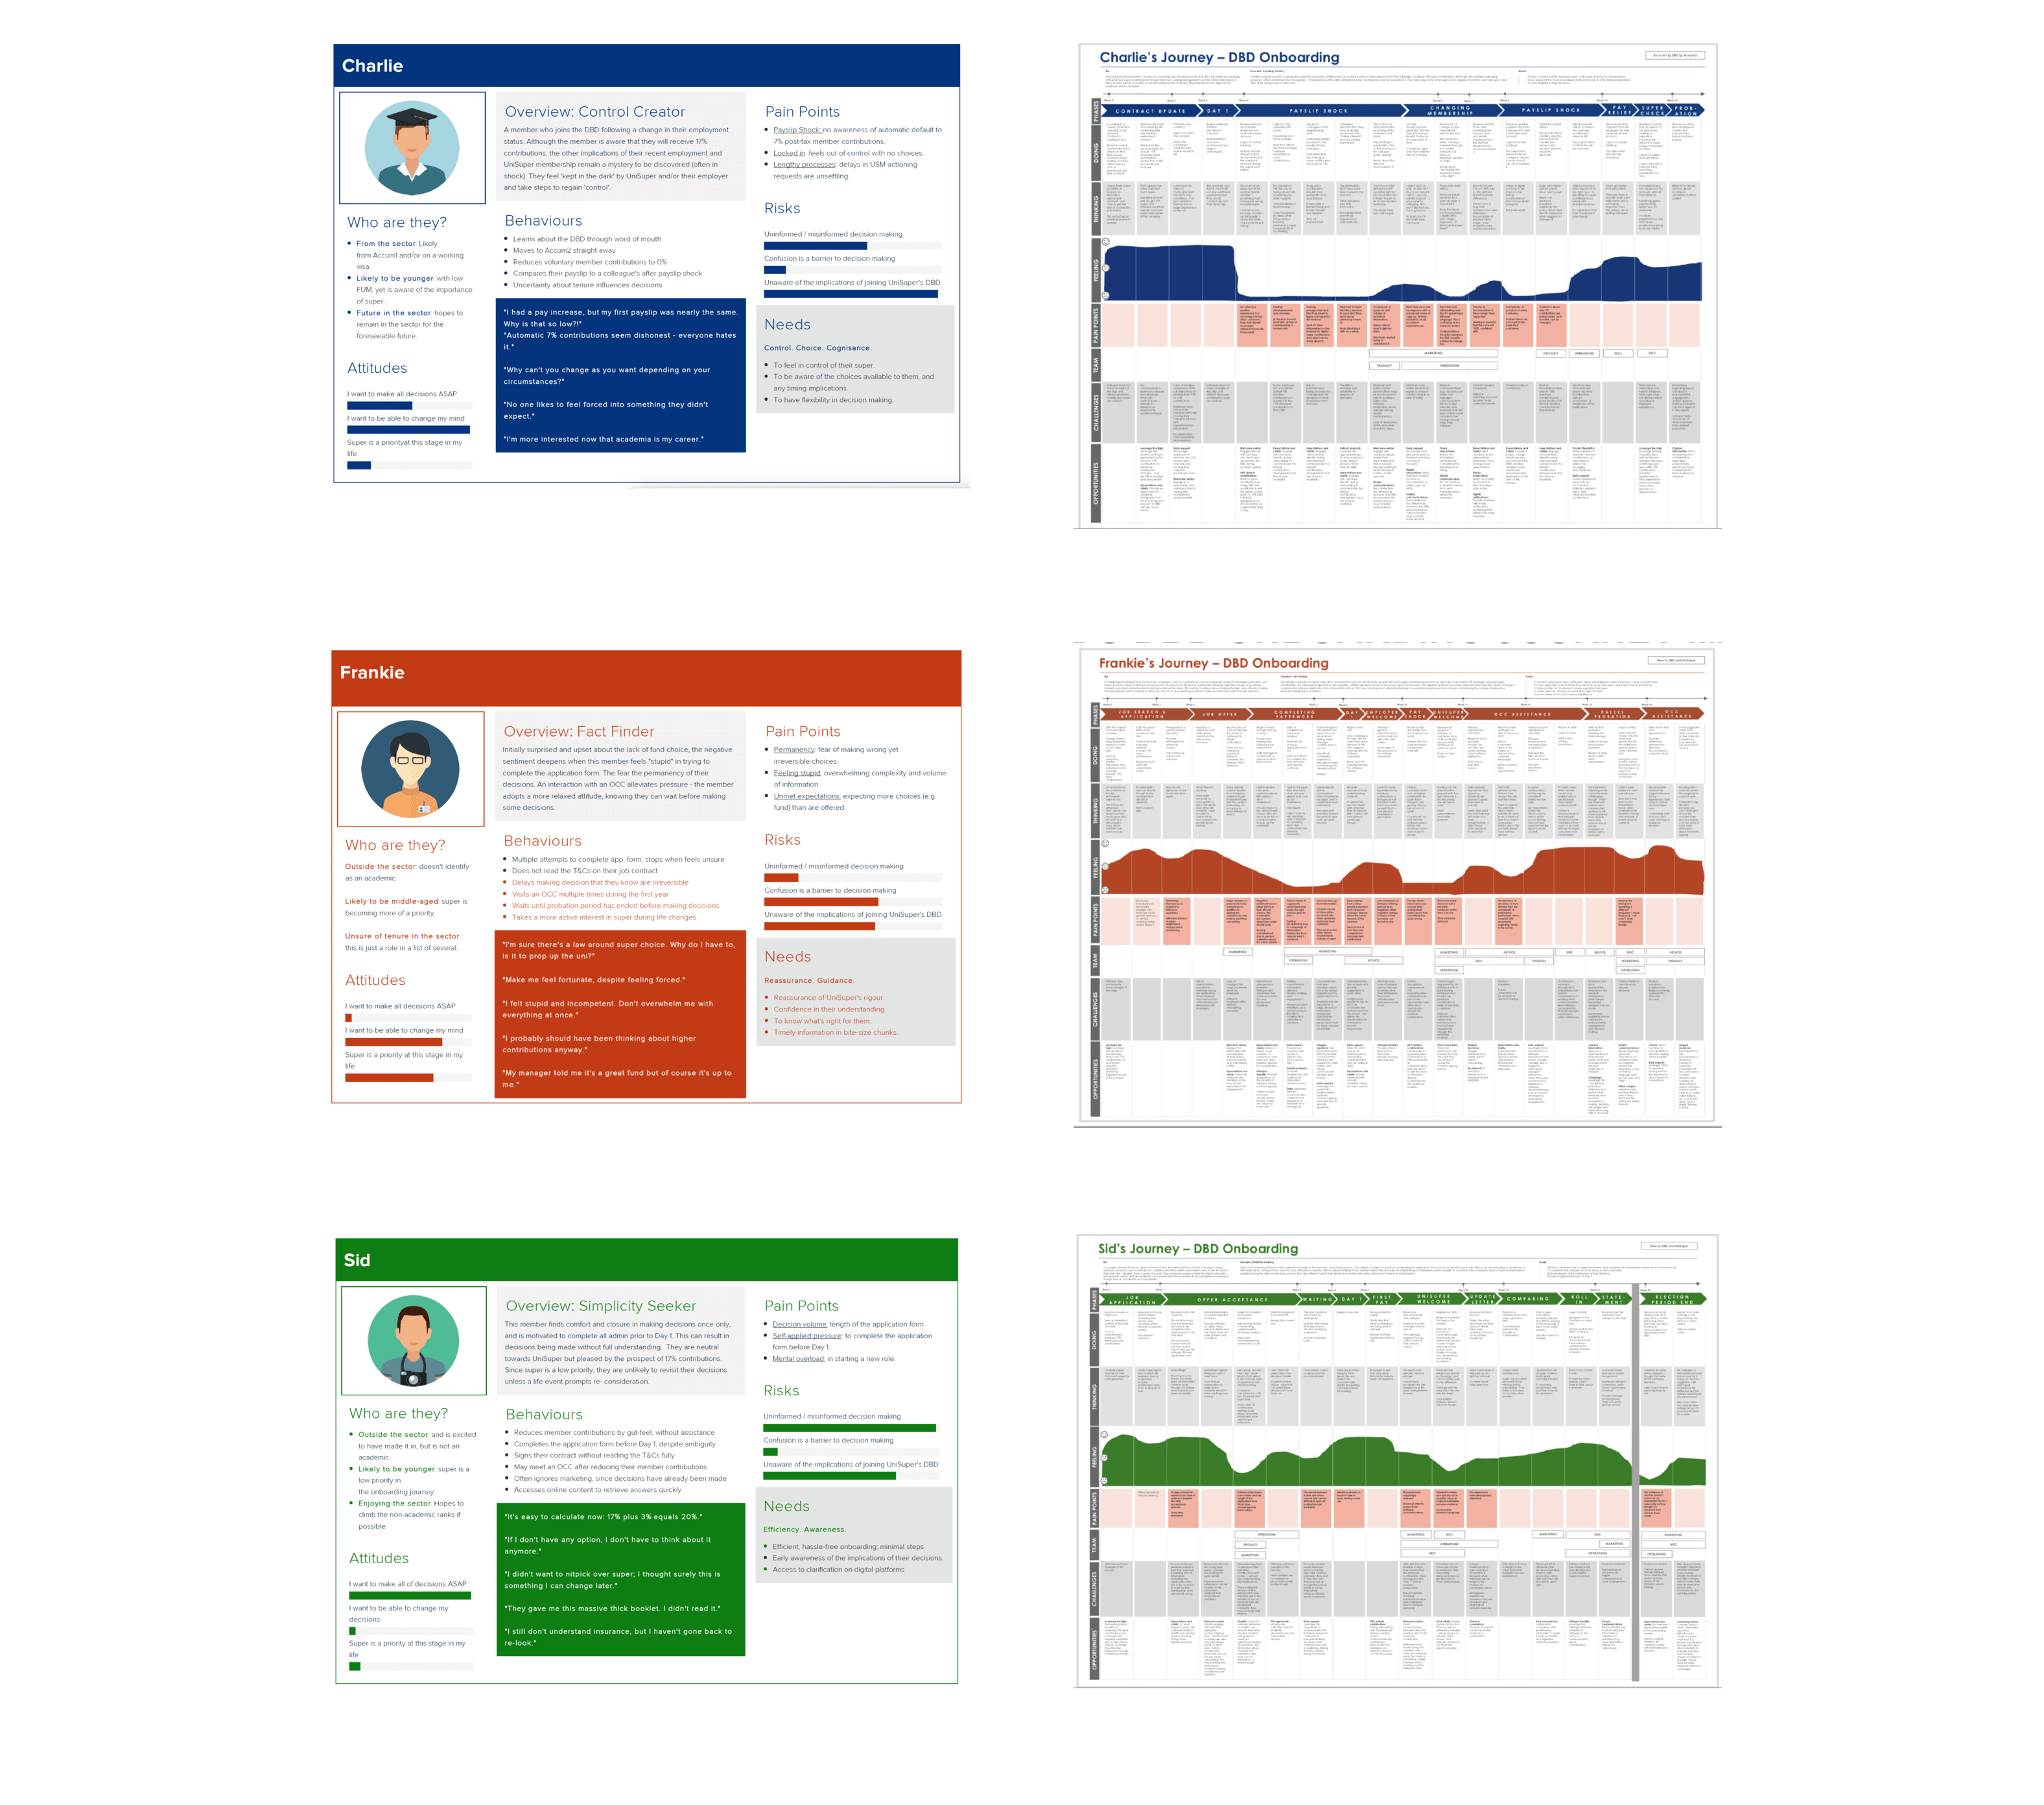
Discover
The three key personas across different products and customer journey maps allowed us to build a holistic understanding of each segement as well as learn about the key nuiances and painpoints between each customer type.
04.-
Key Insights
Key Insights
Members have a fear of permanent decisions
• Members have a low understanding superannuation and are fearful of making the wrong choice without knowing the right informaiton
Members who have low understanding experience unplesant surprises
• Payslip shock = 17% + 7% default contribution
• Accumulation 1 to Defined Benefit Division members lack awareness around default insurance
• Low awareness about the two year election window
• Once voluntary member contributions dial down, it can't go up
Priortisation of super is low in the context of a new job
• For the majority of indivdiuals, super is not top of mind when starting a new job
• To-be members are stressed and time poor
05.-
Opportunity
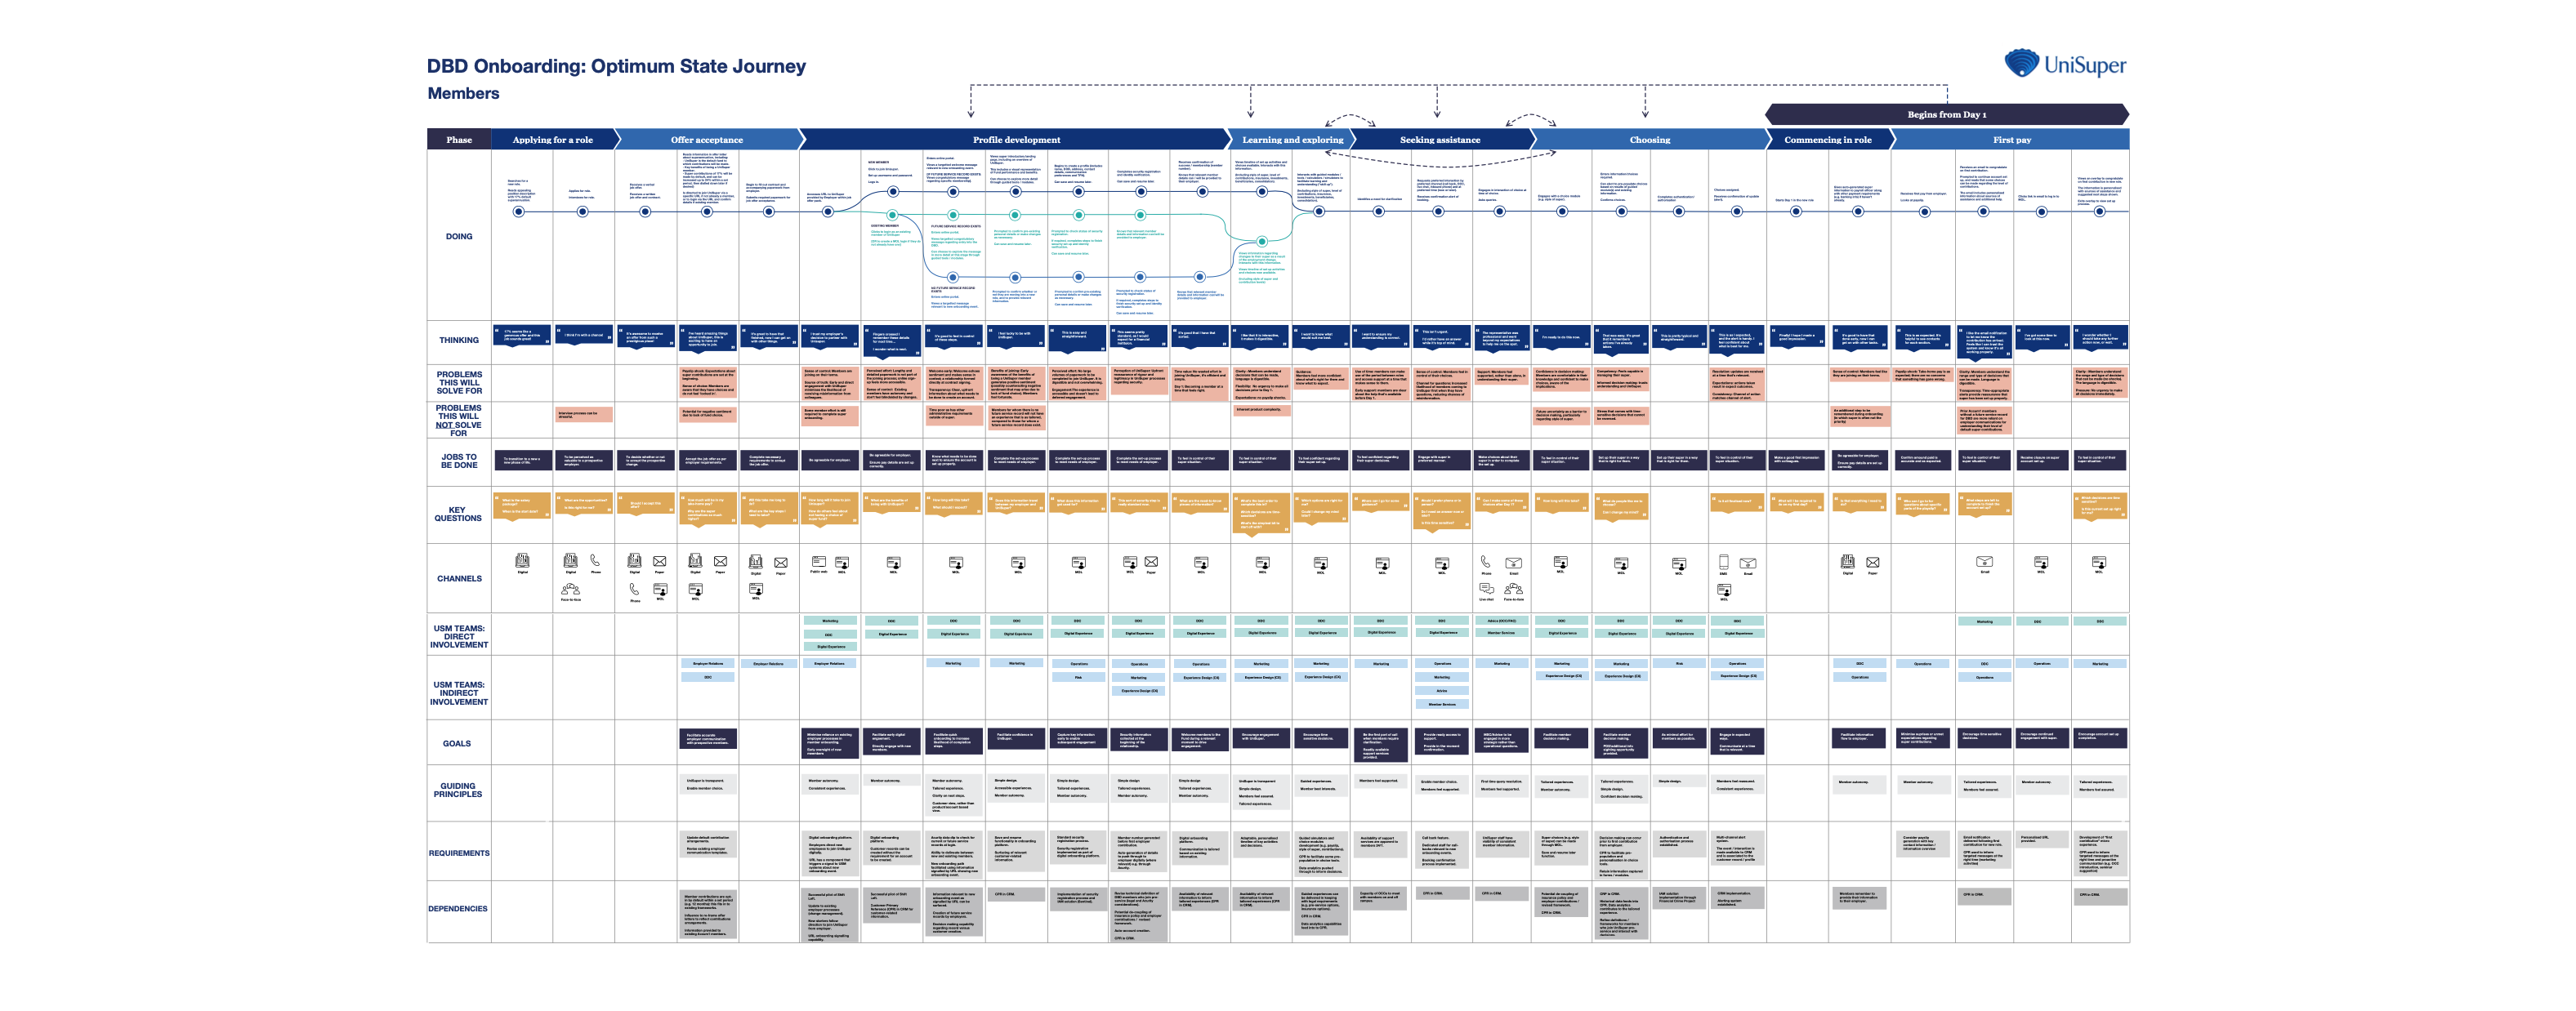
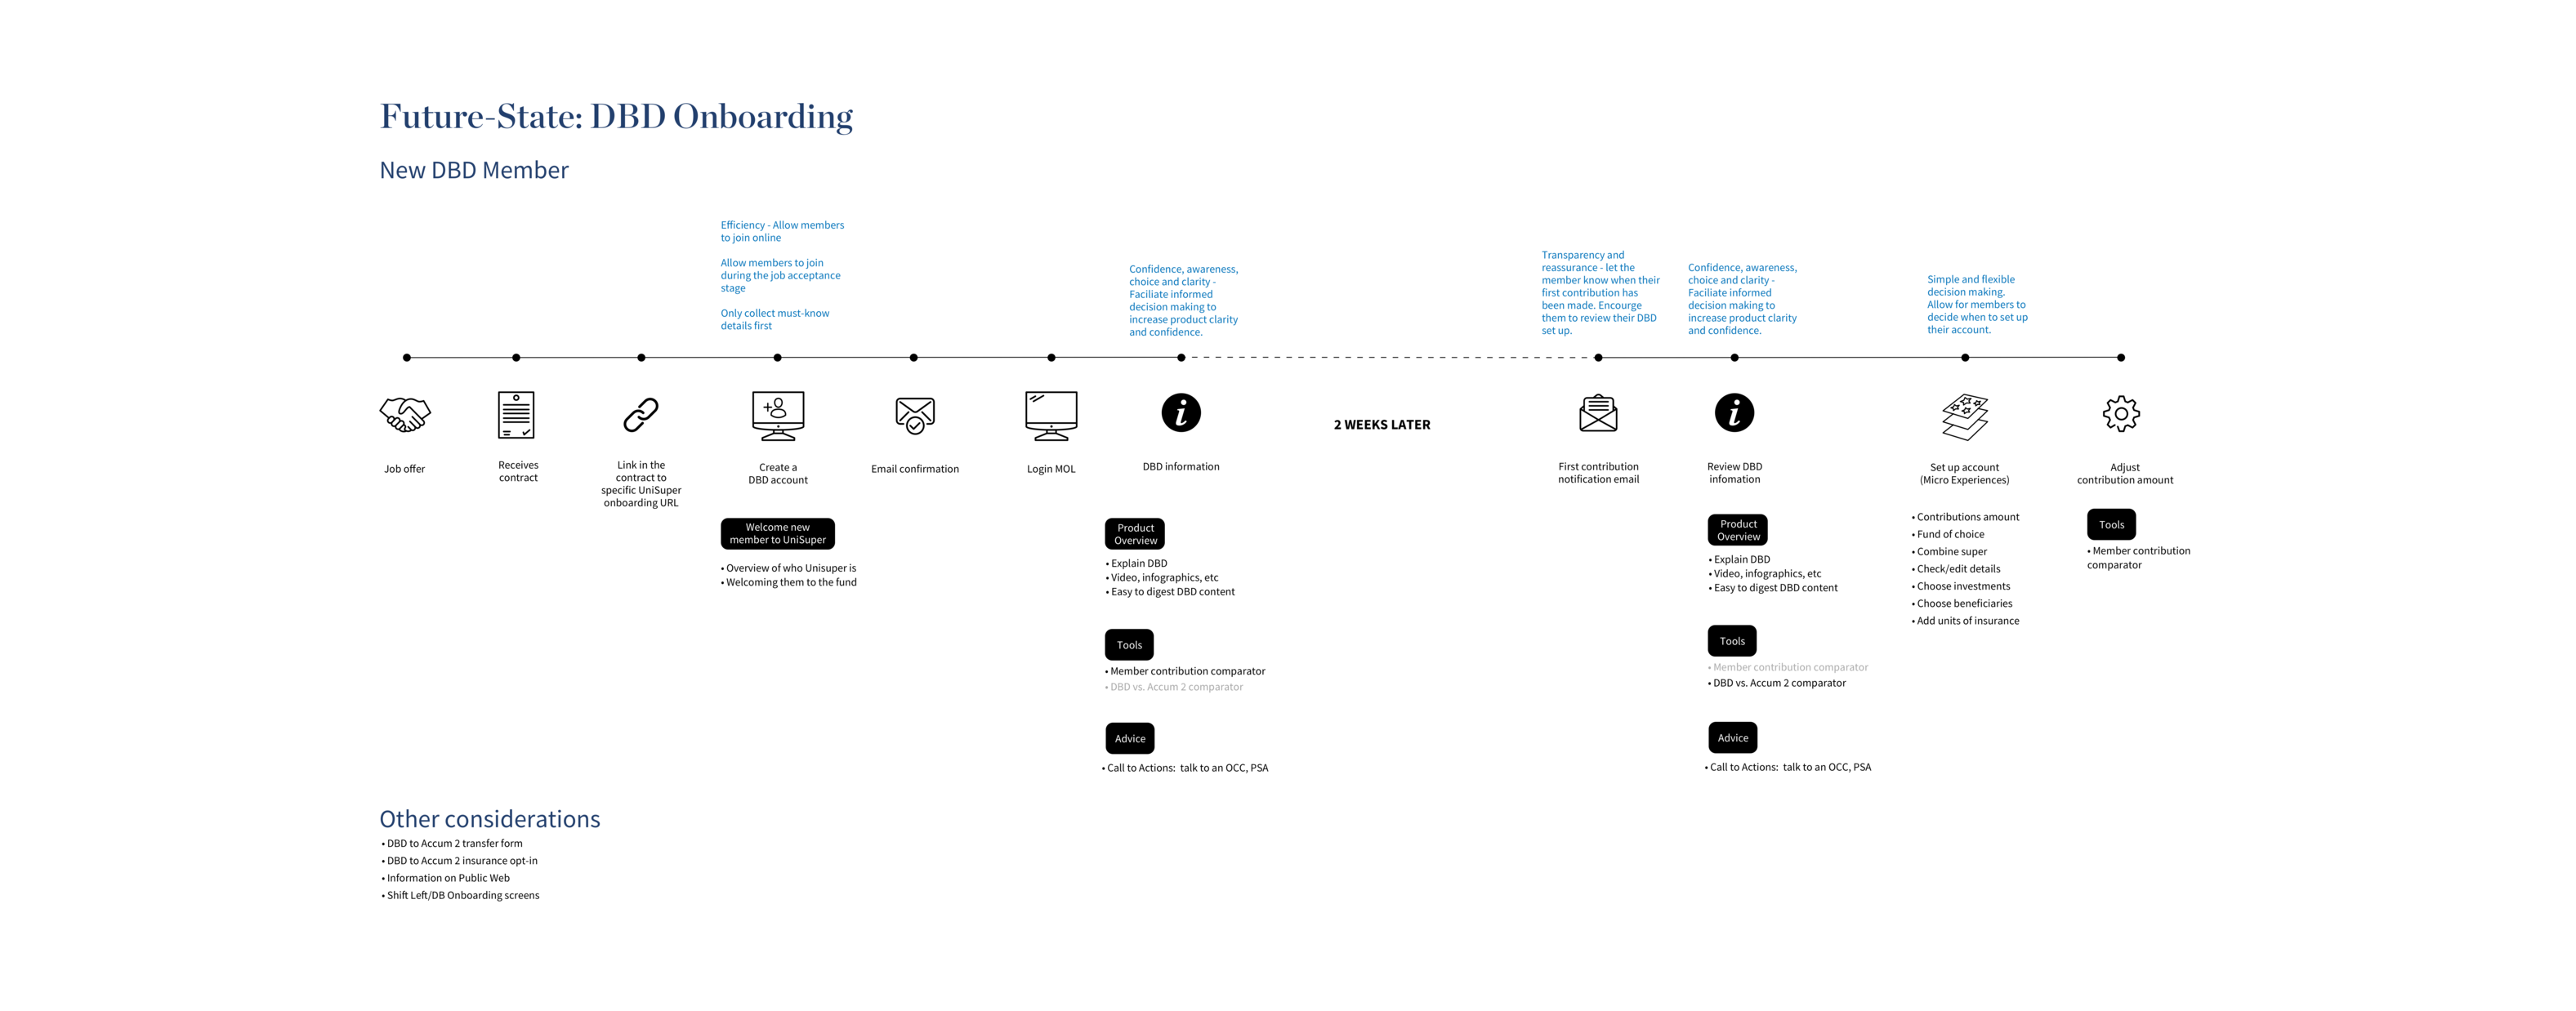
Key areas of focus for the optimum onboarding journey
The optimum state journey map we created articulates the ideal experience for our Defined Benefit Division members. It explores the journey from a member perspective (steps, thoughts, existing pain points solved for/not solved for, jobs to be done, key questions, personas and channels) as well as a UniSuper perspective (teams, goals, guiding principles, dependencies and requirements).
Key opportunities are:
• Allow members to join UniSuper online and on their own terms
• Allow members to join during their job acceptance
• Allow for informed decision making (enhanced disclosure) through micro experiences, education (product overview) and comparator tools
• Focus on key decisions & framing and uplift technical communication
06.-
Ideate
Concept Sketches
07.-
Design & Test
Usability & Concept Testing
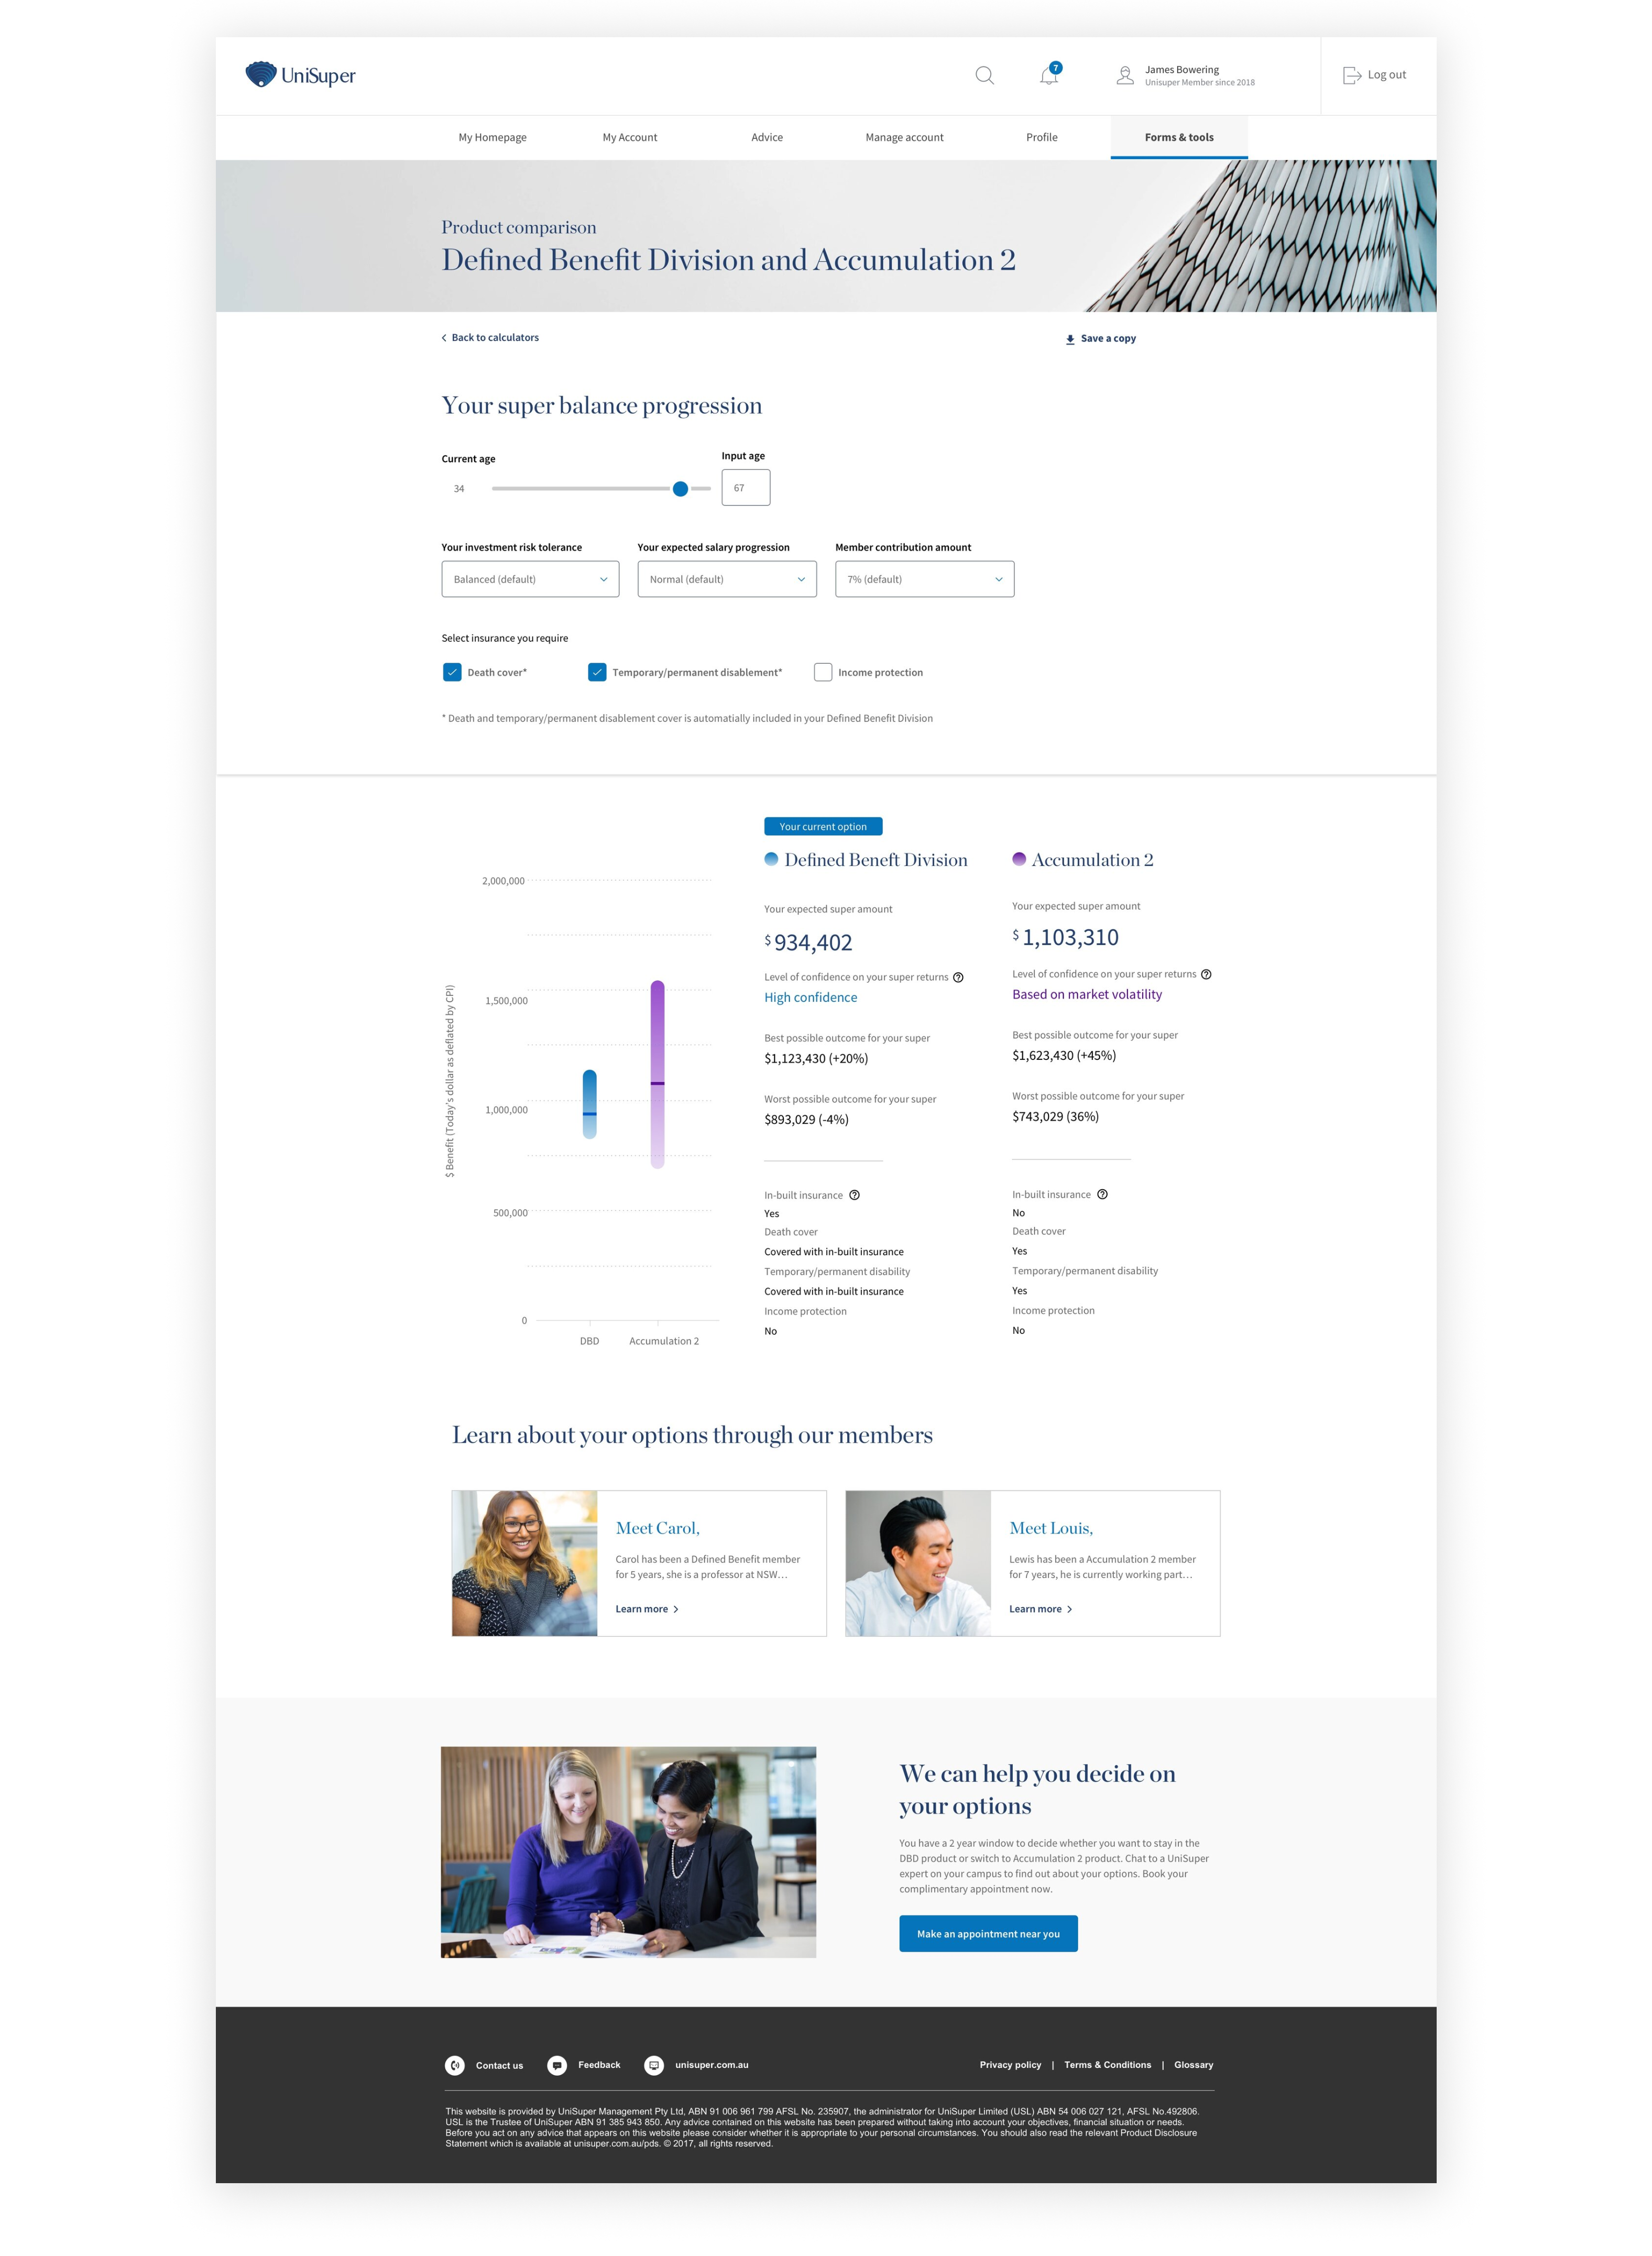
The Strategy, Marketing and CX team undertook a usability testing round with six participants to test a newly-prototyped tool for Defined Benefit Division (DBD) members to compare their estimated retirement outcomes between the DBD and Accumulation 2 products.
Participants were provided with two concepts to view on a desktop and provide their feedback on each prototype - as well as completing a survey for each prototype.
Key objectives were:
• Can participants clearly understand the information provided?
• Does the graph help inform their decision-making to choose a product?
• Can participants select a preferred prototype?
• Would participants like to see some supporting information (besides the graph) to help inform their choice between the two products?
Visit the prototype here.
08.-
Testing Results
Summary of testing results
The testing revealed the following:
• Difficulty comparing products: several key components on both concepts confused or misled participants at various points throughout the sessions, including the timescales, the retirement ranges and the overall graph representations.
• Clarity around age: five out of six participants encountered difficulty defining their age within the graph in first concept design.
• Providing context and disclaimers: five out of six participants said they would require more information before making a product decision.
• Concept provided general information: all participants said they felt the tool provided them with general information and did not giving them advice on what to do or provide a recommendation.
09.-
Delivery
Revised Design